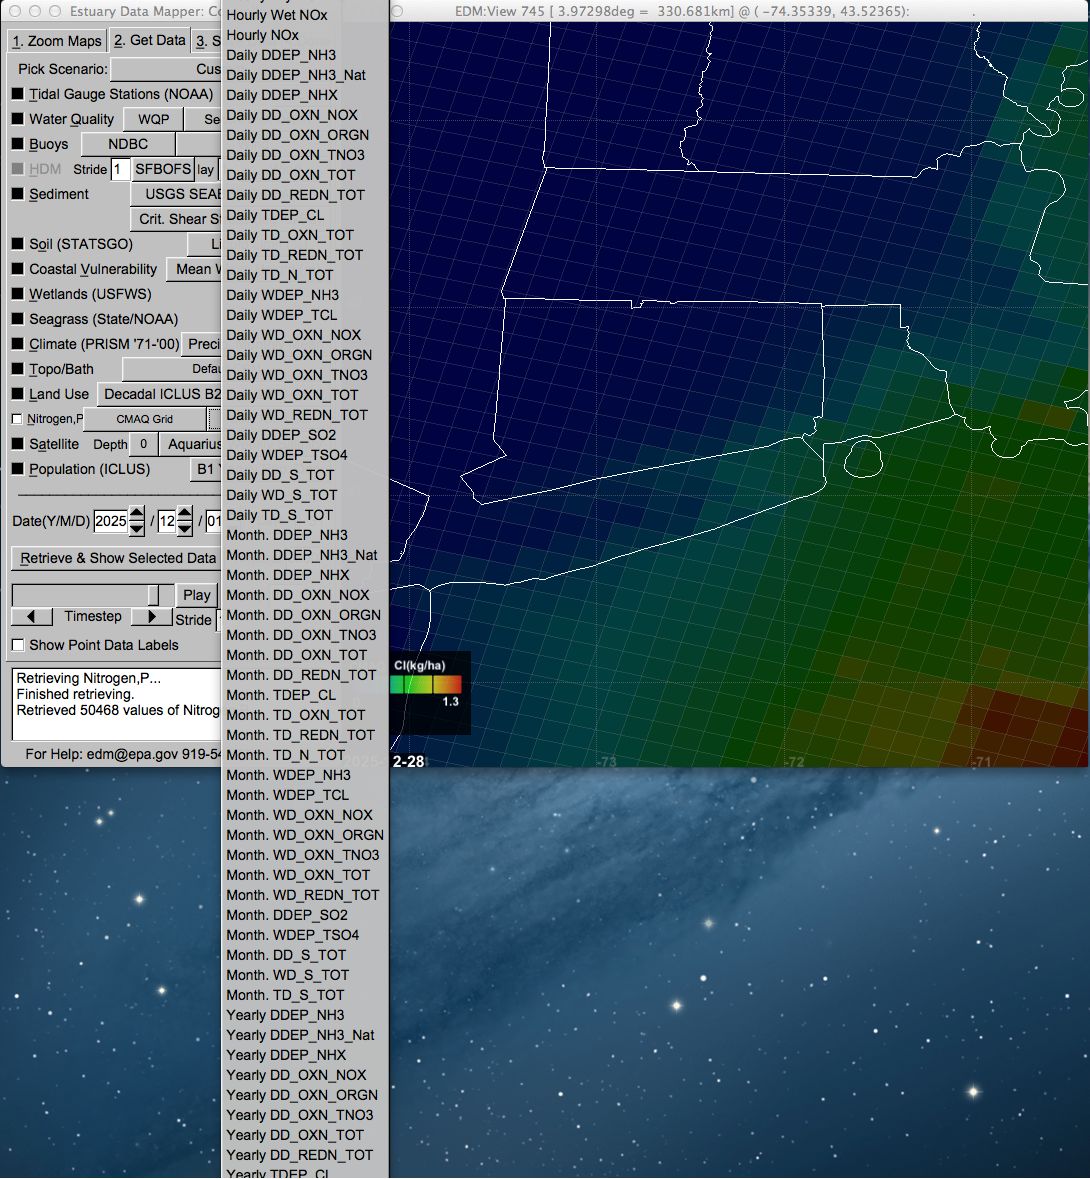
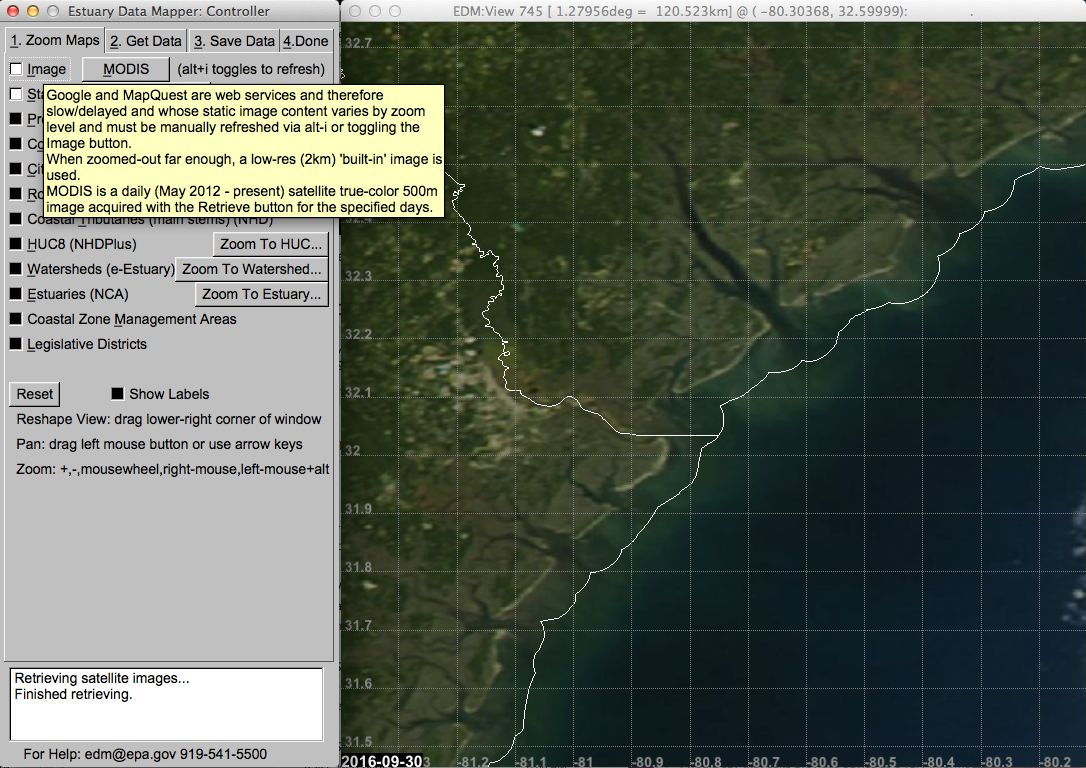
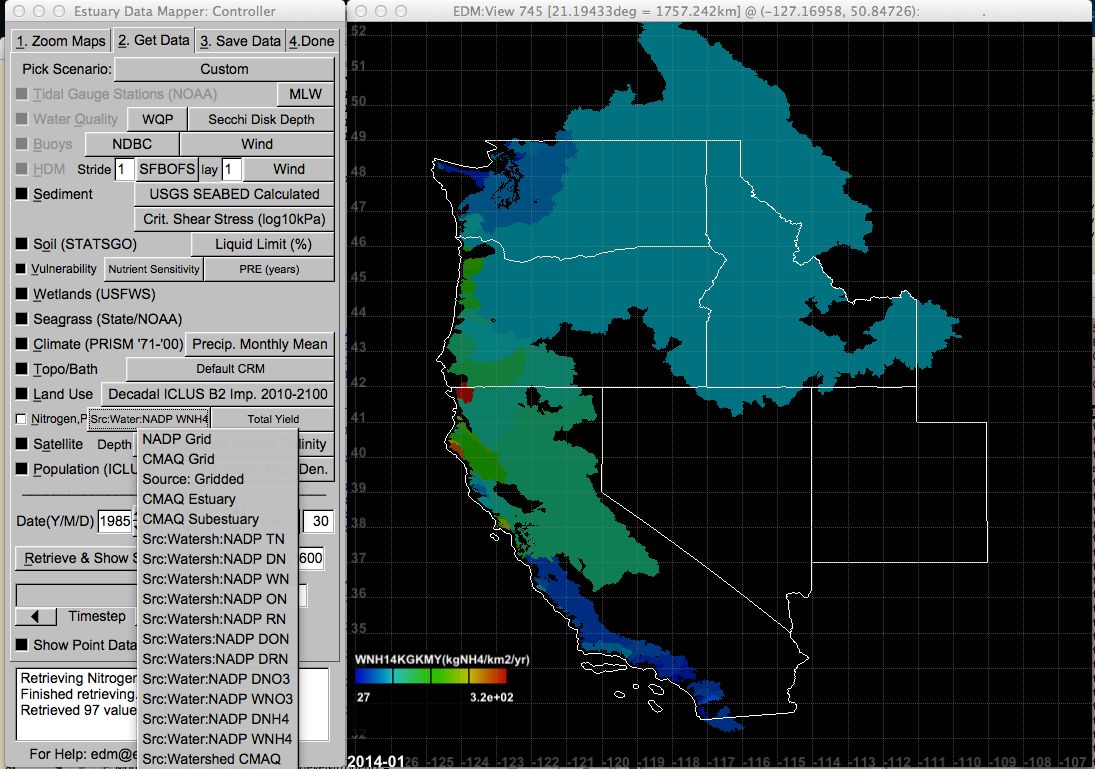
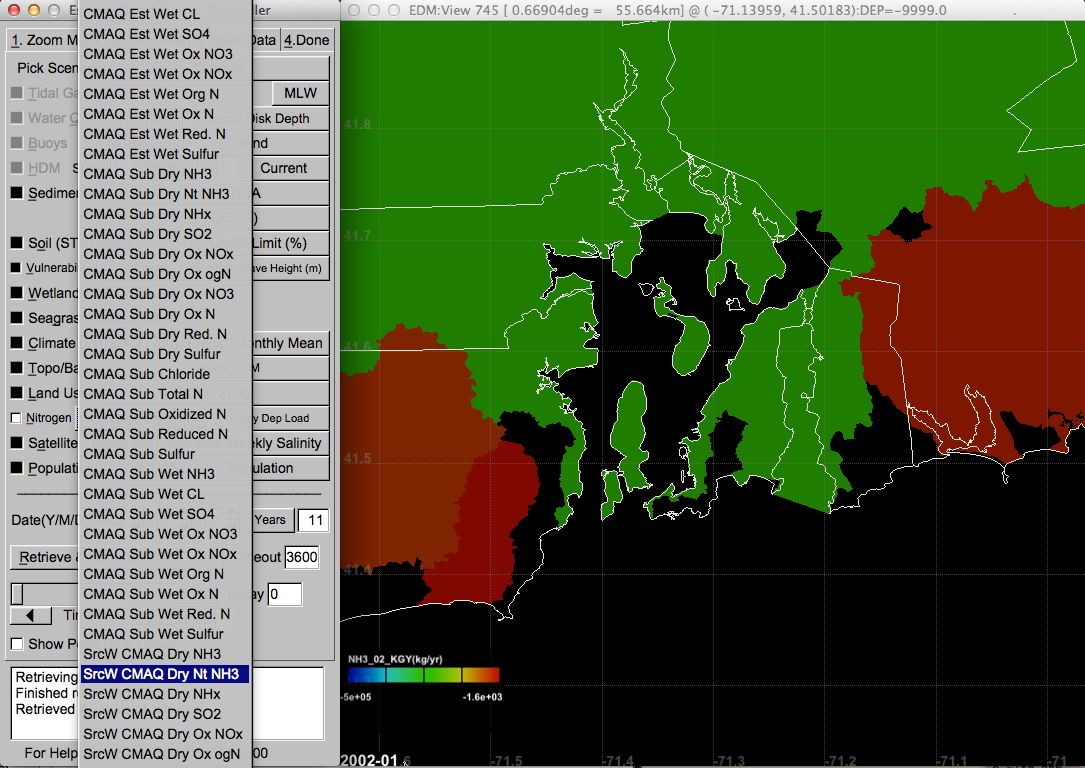
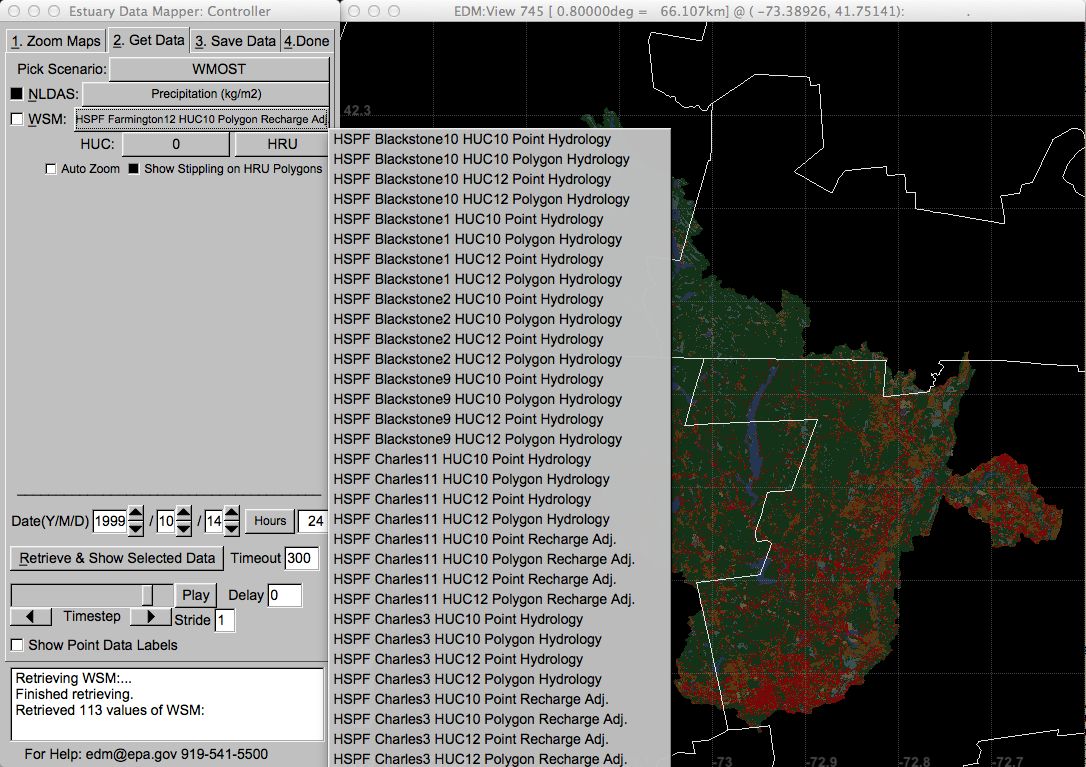
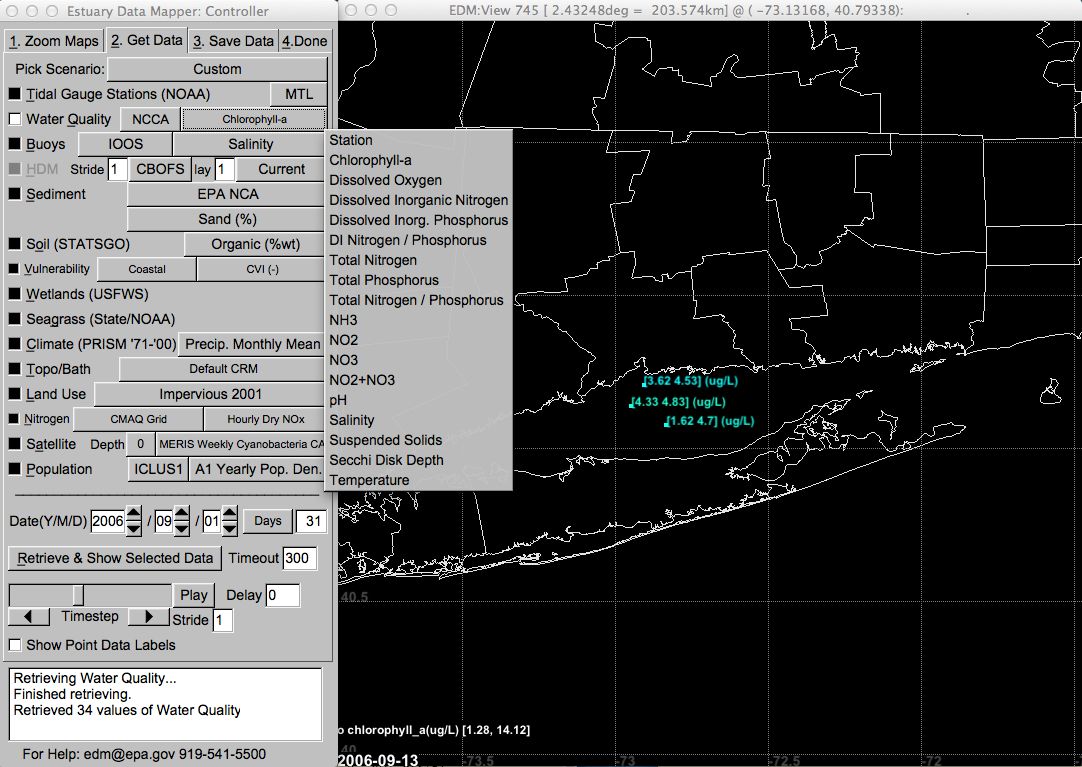
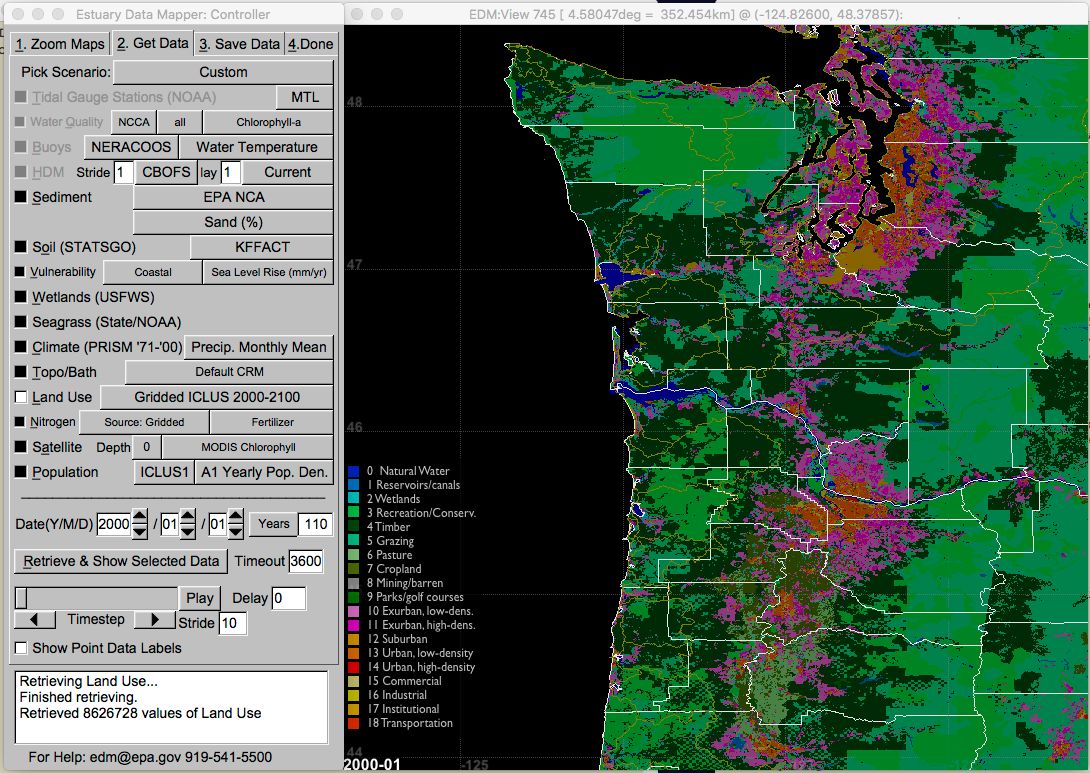
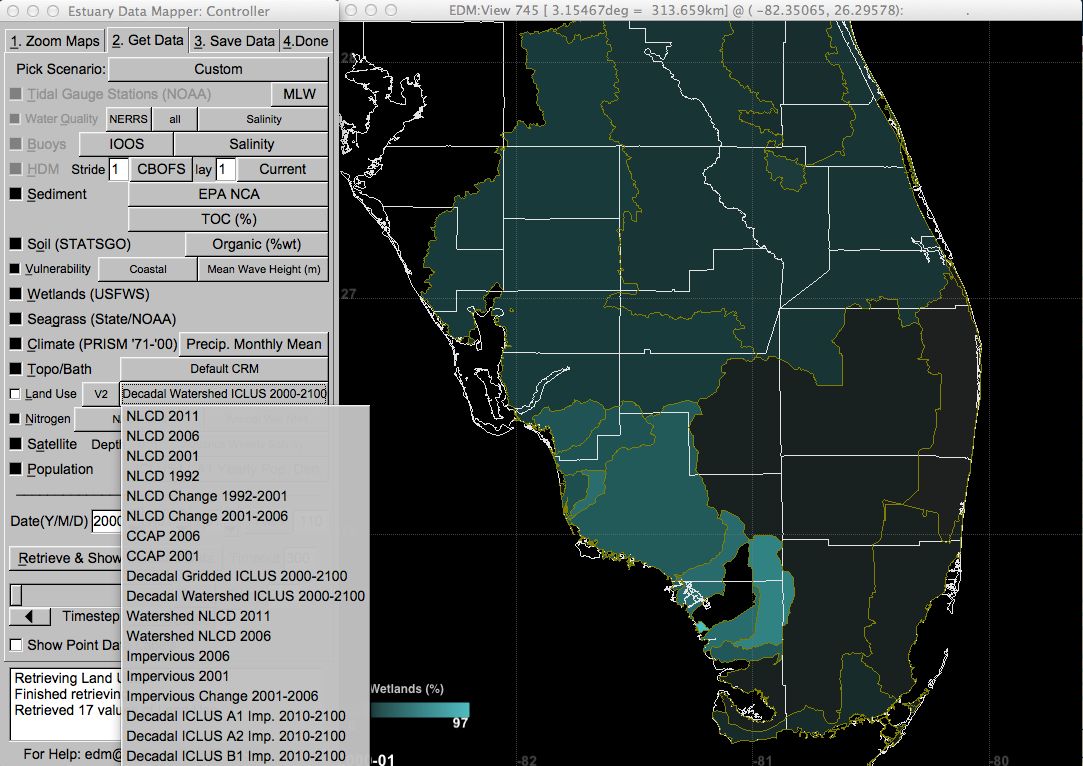
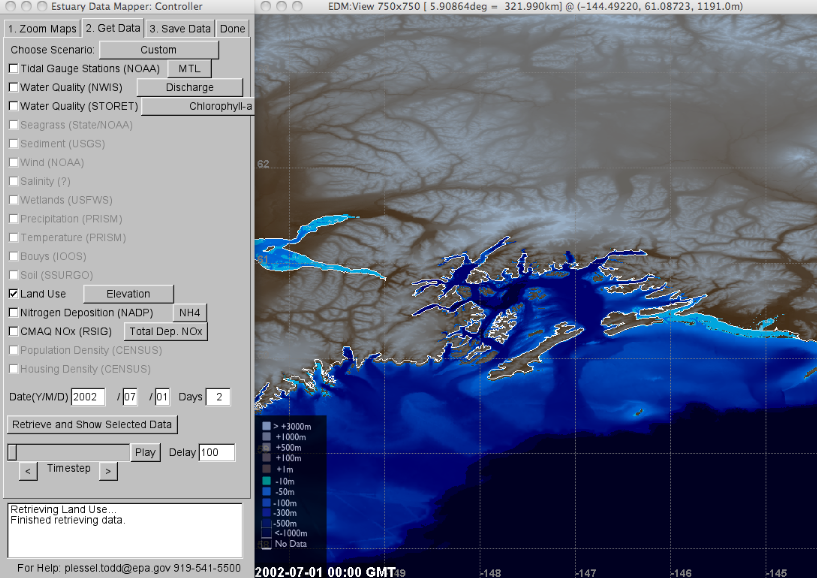
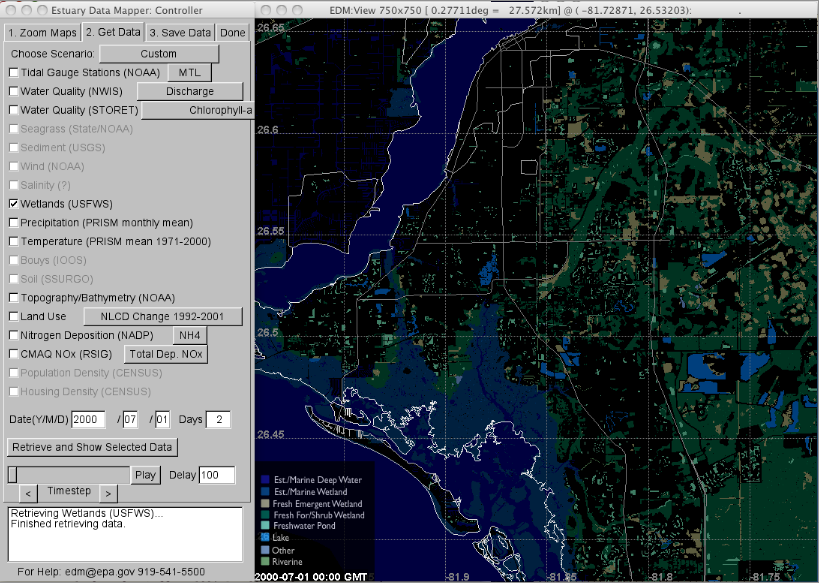
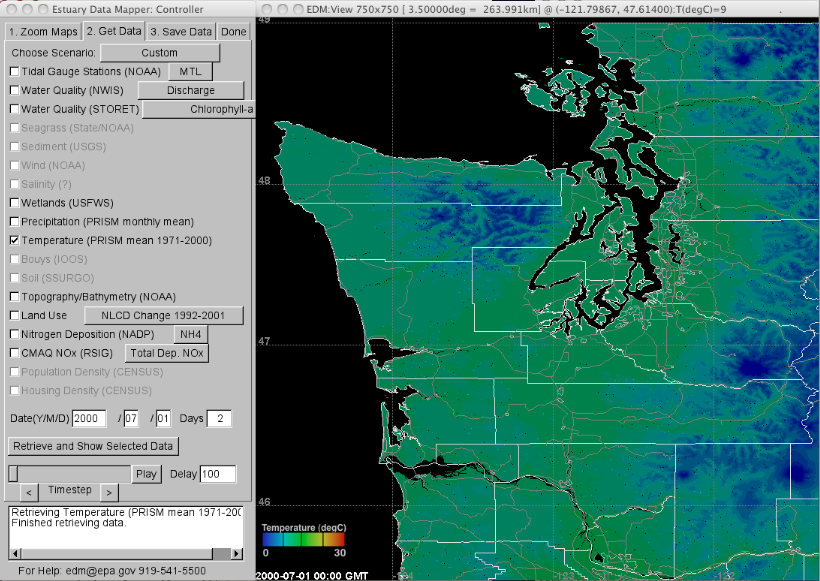
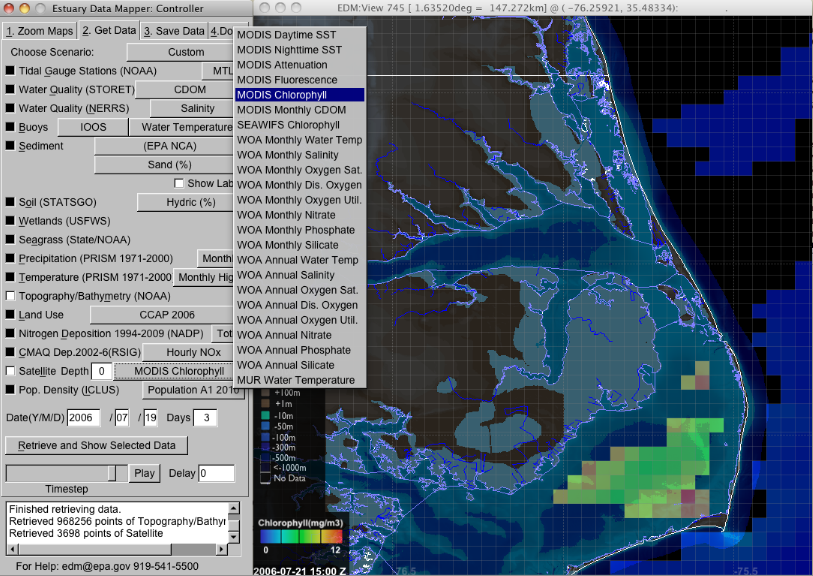
Estuary Data Mapper (EDM) Image Gallery
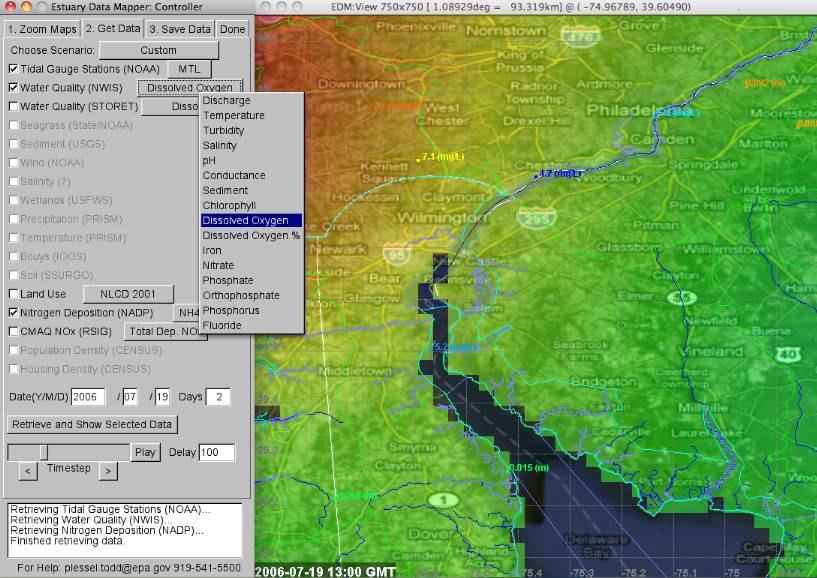
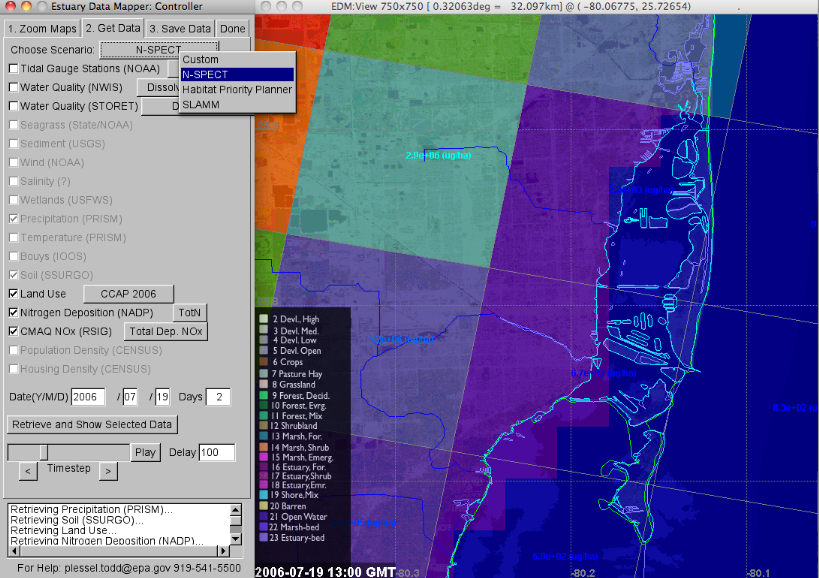
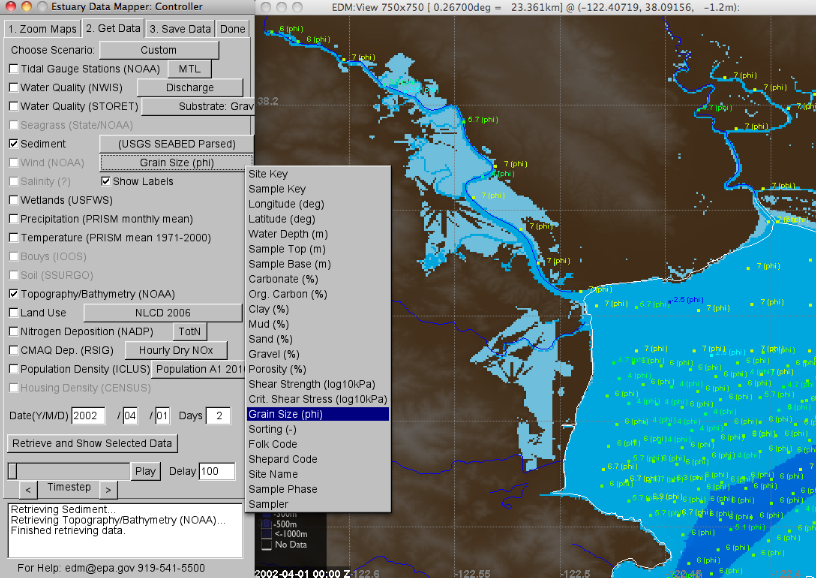
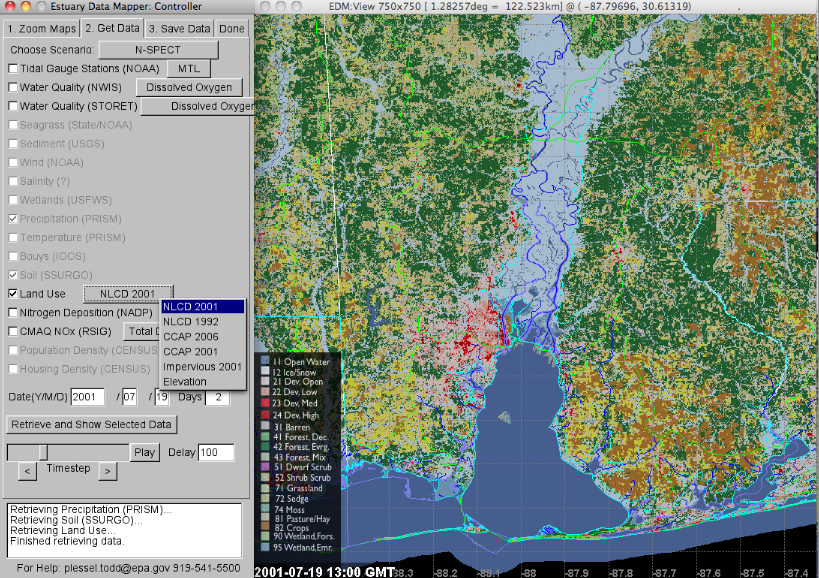
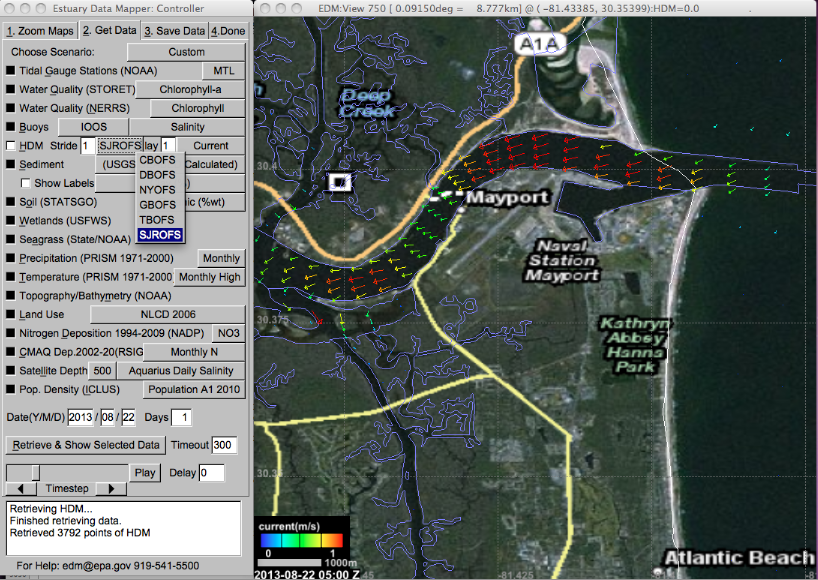
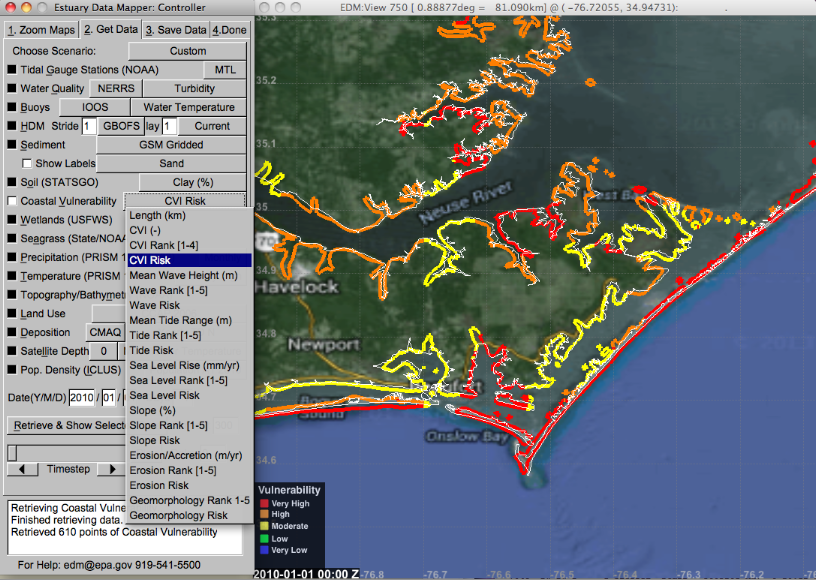
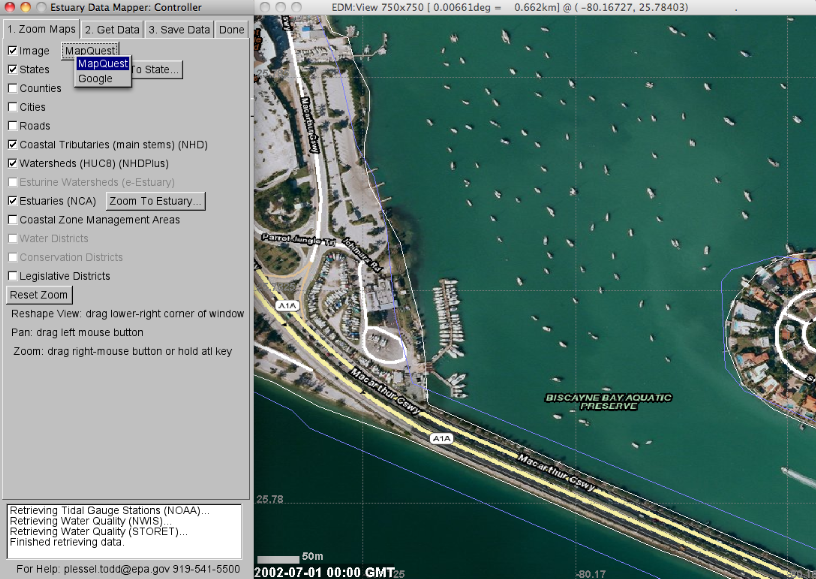
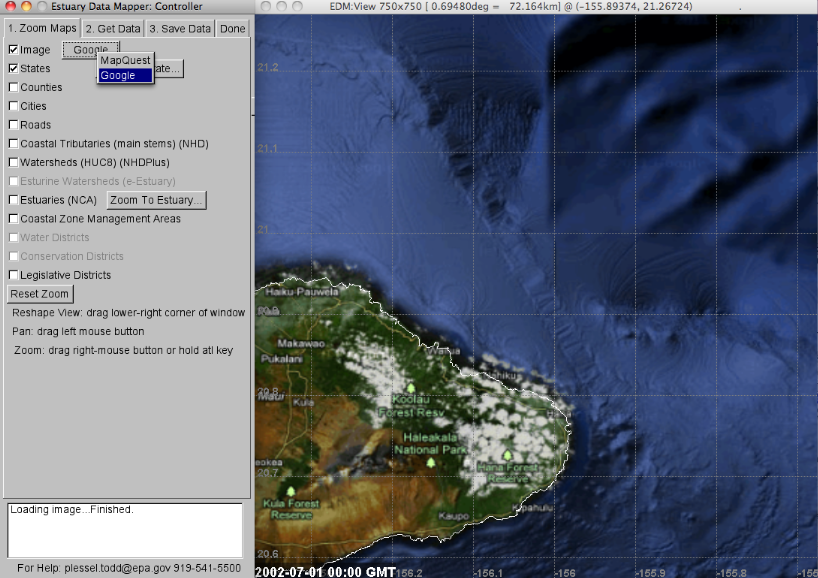
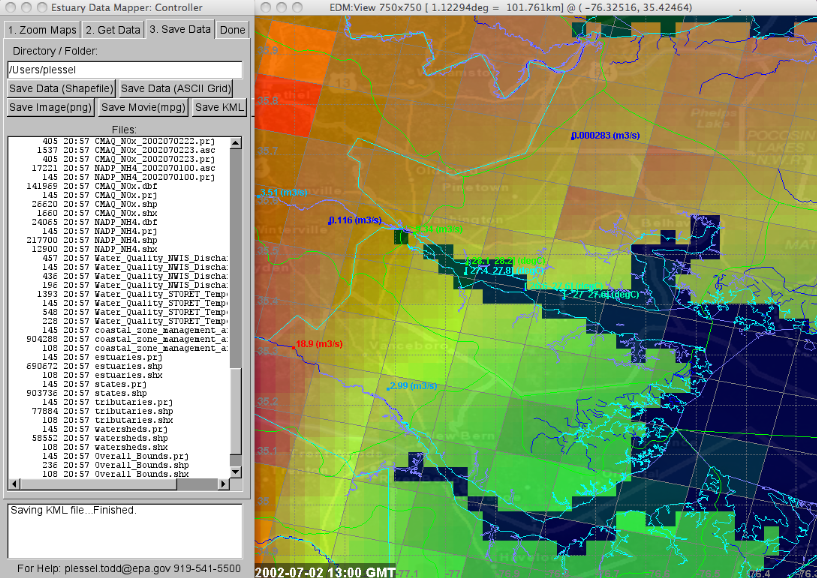
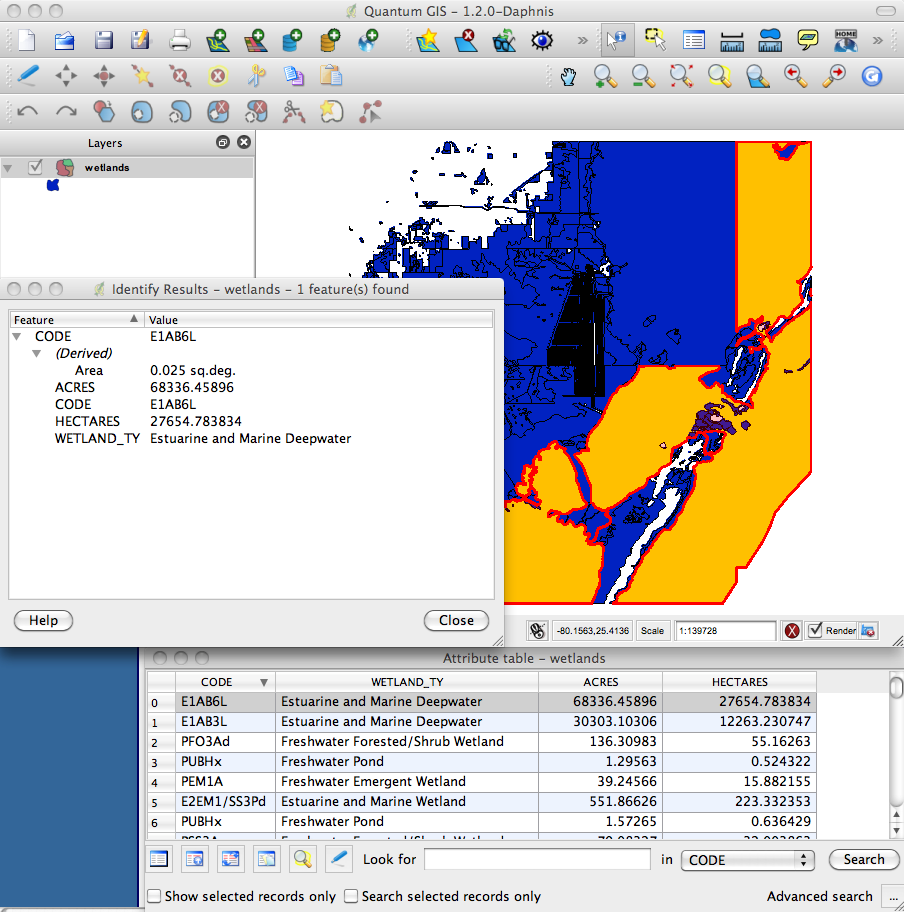
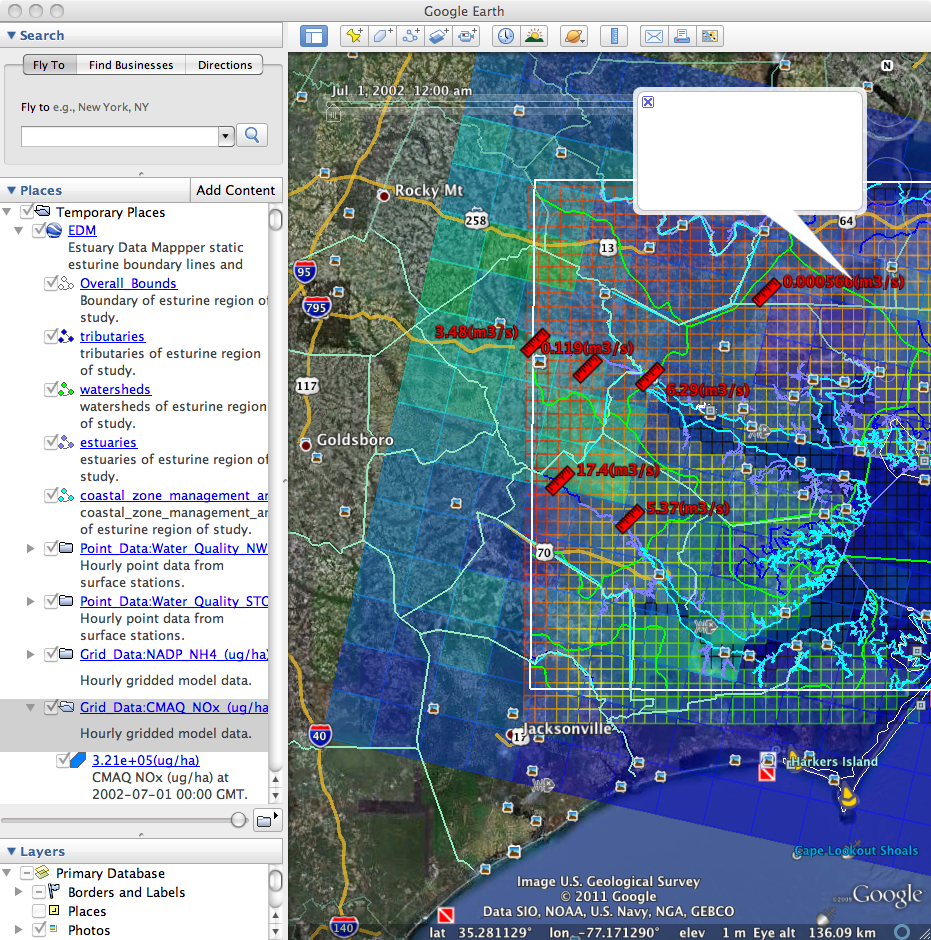
The Estuary Data Mapper (EDM) is a free, interactive graphical application under development by the US EPA that allows scientific researchers to quickly and easily view, retrieve, and save data of interest to estuary researchers and decision-makers.
The following screenshot gallery illustrates the types of data that EDM makes available.