
Lean & Water Toolkit: Chapter 3
Finding Water Waste on the Factory Floor
- Water Gemba Walks
- Developing a Water Balance
- Water Waste and Value Stream Mapping
- Root Cause Analysis
- To Consider
- Footnotes
- Toolkit Navigation
Some of the most substantial reductions in water use can be found right on the factory floor. This chapter describes several simple techniques to foster an understanding of where water goes in a facility and where it can be saved. While all of these techniques evaluate aspects of facility water use and can support your Lean efforts, each has a different level of detail, time, and staff investment required—ranging from a facility walk to a multi-day value stream mapping event. Consider the level of effort desired before getting started to conduct the most effective analysis for your facility’s needs.
Water Gemba Walks
- Identify major sources of water loss, such as leaks, that can be repaired for significant savings
- Acquire a more complete understanding of the major end uses of water and flows of water in the facility than can be achieved solely by analyzing water utility bills
- Instill floor managers and workers with the importance of looking for and noticing leaks and inefficiencies, helping to create a culture of water efficiency
Before you conduct your gemba walk, first, determine the purpose and scope of the walk. How large an area will the walk cover, and how long will it take? How long will the team look at certain aspects of plant operations? What information or data would equip the team to best see wastes and opportunities? Second, obtain copies of relevant documents and data, including the last year of water utility bills or water consumption logs, the floor plan of the facility if available, and process diagrams for focus areas. Third, select the members of the gemba walk team. A small team is best, with approximately five to seven people constituting an ideal team size. Include workers and managers familiar with the area, outsiders, new employees and veterans, as well as an EHS representative in order to get a diversity of perspectives. A brief training can orient your team to the purpose of a gemba walk and help them feel empowered to spot wastes throughout the walk.
Consider conducting your gemba walk during a time when the facility is shut down, as this can be a good time to find unexpected losses. You can also collect data during your gemba walk on the nature of the water in use at various steps throughout each process; knowing when
Box 9 lists some examples of successful gemba walk and leak detection efforts.
Developing a Water Balance
While a gemba walk will help you identify potential water-savings opportunities, developing a water balance will give you a more thorough picture of overall water use at your facility. A water balance is a high-level, simple assessment of the input and output of water in your facility that can help to identify opportunities for improving water efficiency. A water balance might be appropriate for your facility, especially if you are just beginning your journey with Lean and water and have not conducted a more detailed water audit.
- Ability to identify processes that present the best targets for reducing water use
- Establishment of baseline water use data, from which improvements in efficiency can be benchmarked
- Creation of a tool with which to compare different water-efficiency improvement strategies
More Detailed Water Audits, Water Assessments, and Water Footprints
In the event that a more detailed assessment of water use and risks is desired, an organization could consider conducting a water audit, water source vulnerability assessment, and/or water footprint analysis. While the results of these methods can inform the use of Lean to improve facility water efficiency, they are typically conducted as stand-alone efforts that can require substantial effort and investment. These methods are only described briefly below in this toolkit.
-

-
-
Water Waste and Value Stream Mapping
By adding water data to value stream maps, value stream mapping can help you:
- Gain a better understanding of where the greatest water waste occurs
- Identify areas where improvements can be made to reduce excess water use and other wastes
- Develop an implementation plan for process improvements to reduce wastes in the value stream, prioritizing water efficiency projects alongside other Lean and environmental projects
- Quantify the expected savings from implementing those improvements
- Create a culture of efficiency as team members from supervisors to floor workers become engaged in cutting waste
Adding Water Waste to Value Stream Maps
Value stream maps depict all the activities in a value stream or a process, along with key metrics that primarily relate to time. Incorporating water considerations into a value stream mapping exercise is as simple as adding the amount of water used at each step onto the value
To create a visual representation of the areas in the value stream map that use the most water, try using different colors of sticky notes for high- and low-water using steps. See Figure 12 for an example of the use of sticky notes to create a value stream map, with water data added to several of the notes.
The implementation plan is a key product from the value stream mapping event. Take care to develop an implementation plan that details the steps to carry out the improvements you have identified, being sure to assign responsibility for each step of the plan. Consult with facility EHS staff and permitting authorities before making any changes that could affect facility emissions or wastewater discharges.
For more information on adding environmental metrics to value stream maps, see Chapter 3 of EPA’s Lean and Environment Toolkit.
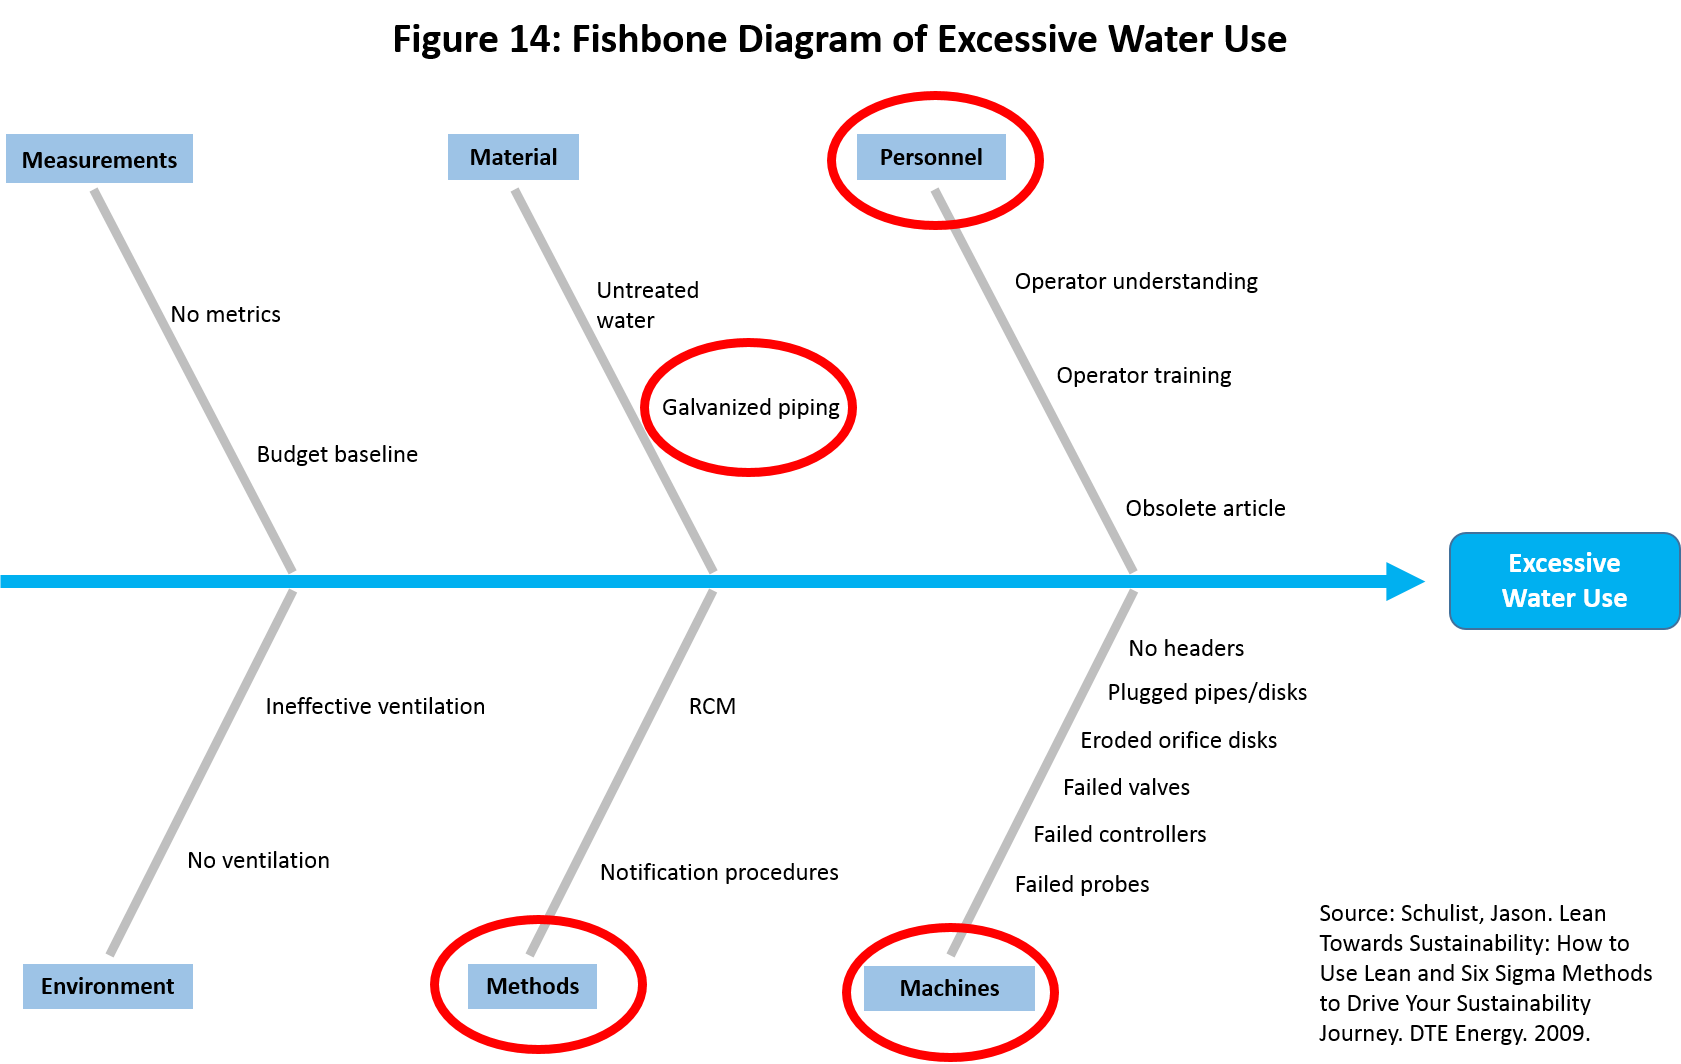
Root Cause Analysis
When you find a water waste in your facility, whether during a gemba walk or a value stream mapping exercise, it’s important to ask, “Why did
- Measurements
- Material
- Man (or Personnel)
- Methods
- Machines
- Environment
Footnotes
1 North Carolina Department of Environment and Natural Resources, Water Efficiency Manual for Commercial, Industrial and Institutional Facilities, May 2009.
Toolkit Navigation
- Contents & Acknowledgements
- Executive Summary
- Preface
- Chapter 1: Introduction
- Chapter 2: Water Use and Water Waste at Industrial Facilities
- Chapter 3: Finding Water Waste on the Factory Floor
- Chapter 4: Lean and Water Efficiency Improvement Strategies
- Chapter 5: Lean and Water Beyond the Factory Floor
- Chapter 6: Conclusion
- Appendix A: Water Efficiency Resources and Technical Assistance Providers
- Appendix B: Water Cost Calculator
- Appendix C: Water Unit Conversions and Calculations
- Appendix D: Water Efficiency Opportunity Checklist
- Appendix E: Glossary of Water Terms